Management discussion and analysis
Investor Capital


SLT’s investors constitute individuals and institutions who provide us with the financial capital we utilise for investments and development. In return, our investors seek reciprocal returns on their investment in the short, medium, and long-term. Through our value adding processes, we create value for the Company and in turn deliver value to our key stakeholders. We work to nurture our relationships with our investors through mutual trust and accountability.
Shareholder profile
The two major shareholders of Sri Lanka Telecom PLC (SLT) as at 31 December 2018 were the Government of Sri Lanka, holding a 49.50% stake through the Secretary to the Treasury, and Global Telecommunications Holdings N.V. (GTH), holding a 44.98% stake. The remaining 5.52% of shares are publicly traded on the Colombo Stock Exchange.
Government of Sri Lanka
The Government of Sri Lanka (GoSL) is the primary shareholder of SLT, which offers many consumers a feeling of reassurance and confidence in the quality of our products and the level of service we offer.
Global Telecommunication Holdings N.V.
Global Telecommunications Holdings N.V. is the holding company of Maxis, the Malaysia-based telecommunication company. Maxis provides technical and telecommunication expertise and assistance to SLT.
Stability
Given the role SLT plays in the country’s development, the stability and long-term viability of the Company is of great importance to stakeholders and the entire country.
Fitch Ratings
Fitch Ratings has downgraded Sri Lanka Telecom PLC’s (SLT) National Long-Term Rating to ‘AA+(lka)’ from ‘AAA(lka)’, which reflects the downgrade of the sovereign’s Long-Term Foreign-Currency Issuer Default Rating (IDR) to ‘B’ from ‘B+’ with a Stable Outlook. Simultaneously, Fitch has downgraded the national rating on SLT’s LKR 7 billion senior unsecured debt programme to ‘AA+(lka)’ from ‘AAA(lka)’.
Investor relations
SLT engages with its shareholders and associated parties via various means including press releases, interim financial results, the Annual General Meeting, our website, and announcements on the Colombo Stock Exchange. SLT’s Annual Report offers comprehensive details on all relevant financial and non-financial information.
Distribution of shares
| Resident | Non-resident | Total | |||||||
| Shareholdings | No. of shareholders | No. of shares | (%) | No. of shareholders | No. of shares | (%) | No. of shareholders | No. of shares | (%) |
| 1 – 1,000 shares | 9,800 | 2,907,531 | 0.16 | 13 | 4,647 | 0.00 | 9,813 | 2,912,178 | 0.16 |
| 1,001 – 10,000 shares | 2,280 | 8,903,271 | 0.49 | 23 | 116,075 | 0.01 | 2,303 | 9,019,346 | 0.50 |
| 10,001 – 100,000 shares | 214 | 4,623,113 | 0.26 | 7 | 252,977 | 0.01 | 221 | 4,876,090 | 0.27 |
| 100,001 – 1,000,000 shares | 6 | 1,040,890 | 0.06 | 1 | 135,447 | 0.00 | 7 | 1,176,337 | 0.06 |
| Over 1,000,000 shares | 8 | 975,118,180 | 54.03 | 1 | 811,757,869 | 44.98 | 9 | 1,786,876,049 | 99.01 |
| 12,308 | 992,592,985 | 55.00 | 45 | 812,267,015 | 45.00 | 12,353 | 1,804,860,000 | 100.00 | |
Categories of shareholders
| Category | Number of shareholders | Number of shares |
| Individual | 12,210 | 15,796,125 |
| Institution | 143 | 1,789,063,875 |
| 12,353 | 1,804,860,000 |
List of 20 major shareholders as at 31 December 2018
| Name | Shareholding | % | |
| 1. | Secretary to the Treasury | 893,405,709 | 49.50 |
| 2. | Global Telecommunications Holdings NV | 811,757,869 | 44.98 |
| 3. | Employees Provident Fund | 25,324,104 | 1.40 |
| 4. | Bank of Ceylon A/C Ceybank Unit Trust | 18,632,709 | 1.03 |
| 5. | Sri Lanka Insurance Corporation Ltd – Life Fund | 17,713,735 | 0.98 |
| 6. | National Savings Bank | 13,158,700 | 0.73 |
| 7. | Employees Trust Fund | 3,302,188 | 0.18 |
| 8. | Sri Lanka Insurance Corporation Ltd – General Fund | 2,041,538 | 0.11 |
| 9. | Bank of Ceylon A/C Ceybank Century Growth Fund | 1,539,497 | 0.09 |
| 10. | The Incorporated Trustees of the Church of Ceylon | 223,590 | 0.01 |
| 11. | Bank of Ceylon No. 1 Account | 214,000 | 0.01 |
| 12. | Pinnacle Trust (Pvt) Limited | 183,984 | 0.01 |
| 13. | Ceylon Biscuits Limited | 161,825 | 0.01 |
| 14. | People's Leasing & Finance PLC/Mr C N Jayasooriya | 150,000 | 0.01 |
| 15. | Elgin Investment Limited | 135,447 | 0.01 |
| 16. | Sinharaja Hills Plantation Pvt Limited | 107,491 | 0.01 |
| 17. | Mrs Edirisinghe | 100,000 | 0.01 |
| 17. | Mr Tanaka | 100,000 | 0.01 |
| 19. | Sampath Bank PLC/Mr D K L Chandrsena | 99,905 | 0.01 |
| 20. | Mr Van Starrex | 97,638 | 0.01 |
| 1,788,449,929 | 99.09 |
Float adjusted Market Capitalisation as at 31 December 2018 – LKR 2.33 Bn.
Percentage of public holding as at 31 December 2018 – 5.52%
Number of shareholders representing the public holding as at 31 December 2018 – 12,353
The Company does not comply with the minimum public holding requirements of the CSE. However, the Board of Directors of the Company has agreed in principle to carry out a private placement in order to comply with the minimum public shareholding as per CSE Rule No. 7.13.1.(a)
Ratio and market price information
Share price trend
| 2018 | 2017 | 2016 | 2015 | 2014 | 2013 | 2012 | 2011 | 2010 | |
| Highest value (LKR) | 30.00 | 36.70 | 46.40 | 54.90 | 57.30 | 50.00 | 50.00 | 64.50 | 51.00 |
| Lowest value (LKR) | 18.90 | 27.00 | 31.20 | 43.00 | 33.33 | 36.10 | 34.00 | 44.00 | 35.00 |
| Last traded price (LKR) | 23.40 | 28.50 | 36.00 | 47.00 | 49.90 | 37.00 | 44.50 | 48.00 | 49.00 |
| Market capitalisation (LKR Bn.) | 42.23 | 51.43 | 64.97 | 84.83 | 90.00 | 66.78 | 80.32 | 86.63 | 88.44 |
Trading activity
| 2018 | 2017 | 2016 | |
| No. of transactions | 3,195 | 3,149 | 3,328 |
| No. of shares traded | 1,113,157 | 1,463,787 | 3,082,282 |
| Value of shares traded (LKR) | 26,852,883 | 46,137,965 | 112,724, |
Equity (Group)
| 2018 | 2017 | 2016 | |
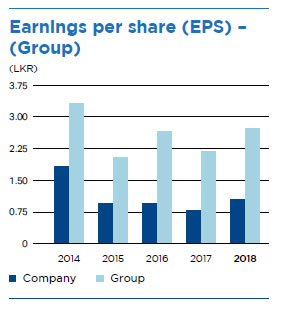
| Earnings per share (LKR) | 2.74 | 2.18 | 2.65 |
| Net assets per share (LKR) | 40.82 | 39.56 | 38.05 |
| Gearing ratio (Debt to LKR 1 of total equity) | 0.43 | 0.37 | 0.32 |
| Quick asset ratio (No. of times current liabilities) | 0.82 | 0.48 | 0.57 |
| Interest cover (Earnings before interest and taxes divided by interest expense) |
1.77 | 2.02 | 4.53 |
| Dividend pay-out ratio (%) | 38.7 | 40.8 | 33.5 |
| Dividend per share (LKR) | 1.06 | 0.89 | 0.89 |
Debt information (Company)
| Interest rate of comparable Government Security (%) | 11.87 |
| Debt/Equity ratio (Gearing Ratio) (%) | 0.44 |
| Interest cover (%) | 0.78 |
| Quick Asset Ratio (%) | 0.62 |
| Market prices and yield during the year (Ex-interest) | |
| Highest Debenture Price | Debentures were not traded during the year 2018 |
| Low | |
| Last traded price | |
| Any changes in credit rating | Fitch rating |